Physical Address
304 North Cardinal St.
Dorchester Center, MA 02124
Physical Address
304 North Cardinal St.
Dorchester Center, MA 02124
Now that we have the tools to describe events of an experiment’s sample space, we can take a closer look at characterizing those events. Specifically, we’ll want to be able to figure out how big an event is, or how many points of a sample space belong to an event. We’ll also want to compare and contrast events. Specifically, we’ll want to be able to tell if two or more events have points in common.
A wide variety of tools exist to help us work with events to yield the information we want. For any experiment with continuous outcomes, we’ll want to use geometric tools including length, area, volume, and so forth. When dealing with experiments with discrete outcomes, we can make use of Venn Diagrams.
While some events are easy enough to deal with by hand, there are tools available to help us quickly work with multiple events from a sample space. Mathematica provides powerful symbolic computing tools. Custom tools can be developed in any number of programming languages. Here, we’ll make use of Maple to do the calculations, and to display the information.
There are various ways to count the number of elements of a discretely defined set in Maple. Consider the problem of counting numbers that are multiples of 3 from 1 to 1000. We could easily form a list in maple that contains all integers from 1 to 1000 inclusive that are multiples of 3. Here is a sample Maple worksheet performing such a task.
Figure 1.2.1: These two commands are the workhorses of the worksheet pictured at the right. The numelems command is described in the provided link under the “Description” section.
> restart:
> upper_limit := 1000:
> multiples_3 := [seq(3..upper_limit, 3)]
> numelems(multiples_3)
333
One curious aspect of Maple is that the seq command had to be enclosed in square brackets []. According to the documentation, the numelems command takes a “list” object as an argument. That is why we wrap the seq command in [], as that is what allows us to store the results of invoking the seq command in a list, as seq does not do this automatically.
After doing this, we see that there are 333 multiples of 3 between 1 and 1000 inclusive.
This method works reasonably well. Now suppose that we want to know how many multiples of 7 exist between 1 and 1000. We can easily repeat the above code, which we’ll do now.
> restart:
> upper_limit := 1000:
> multiples_7 := [seq(7..upper_limit, 7)]
> numelems(multiples_7)
142
This number appears to be 142. Now suppose, we wanted to know how many numbers are multiples of both 3 and 7. There are a couple of different ways we could do this. One way is to figure out what the least common multiple of 3 and 7 is, which would be 21. We then simply repeat the above code with the appropriate substitutions.
Another way is to use the tools of set theory. In this case, we could just take the intersection of the multiples of 3 and the multiples of 7.
We use both methods in the next script.
Figure 1.2.2: While the linked documentation for this command mostly references polynomials, it works as expected when used with two positive integers. It also works with more than two positive integers.
> restart:
> upper_limit := 1000
> multiples_3 := {seq(3..upper_limit, 3)}:
> multiples_7 := {seq(7..upper_limit, 7)}:
> common := lcm(3, 7):
> numelems(seq(common..upper_limit, common))
47
> intersection := multiples_3 ∩ multiples_7:
> numelems(intersection)
47
In this worksheet, we replaced the square brackets [ and ] with the curly brackets { and } respectively. This allows us to collect the multiples of 3 in a set, and the multiples of 7 in a different set. We can then use the intersection operator on both sets (the intersection operator does not work on lists.) As can be seen, both methods yield 47.
Another problem arises if we now want to know how many numbers from 1 to 1000 inclusive are not multiples of 3 or 7. We can’t simply do the calculation
| 1000 – (multiples of 3) – (multiples of 7) | |
| = | 1000 – (333) – (142) |
| = | 525 |
Remember that 47 numbers belong to both sets of numbers. This means that the above calculation subtracted those numbers twice. To correct that, we can simply add the number of multiples of both 3 and 7 back to the total. Here is the correct calculation.
| 1000 – (multiples of 3) – (multiples of 7) + (multiples of both 3 and 7) | |
| = | 1000 – (333) – (142) + (47) |
| = | 572 |
So there are 572 numbers that are not multiples of 3 or 7. It took a lot of work to get to this point. While we wanted to know all of the above information, it was all intermediary as well. Now suppose we want to know how many multiples of 3 there are that are not also multiples of 7, and vice-versa. That requires more work, though admittedly, not too much now that we’ve reached this point.
Maple offers tools to quickly figure out all of these numbers that we wanted. In the Statistics package exists the VennDiagram command. We can get these counts very quickly in a few short commands.
Figure 1.2.3: The VennDiagram command gives us a lot of information, and can be used with one, two, three, four, or even five sets.
> restart:
> with(Statistics):
> upper_limit := 1000:
> multiples_3 := {seq(3..upper_limit, 3)}:
> multiples_7 := {seq(7..upper_limit, 7)}:
> numbers := {seq(1..upper_limit)}:
> [numelems(multiples_3), numelems(multiples_7)]
[333, 142]
> VennDiagram(multiples_3, multiples_7, universe = numbers, legend=[“Multiples of 3”, “Multiples of 7”])

With this one command (arguably two,) we’ve got all the information about multiple events that are all interrelated. The VennDiagram command itself gave us how many numbers are multiples of 3 but not 7 (286), how many numbers are multiples of 7 but not 3 (95), numbers that are multiples of both 3 and 7 (47), and numbers that are not multiples of 3 or 7 (572, which agrees with one of our previous calculations.) To figure out how many numbers are multiples of 3 in total, we’d have to add 286 to 47, likewise with total multiples of 7. That’s why I said there were arguably two commands, because I used the numelems command twice to get those sums.
The documentation linked above in Figure 1.2.3 will direct you to additional options you can use to increase the font size in the diagram, and you can also increase how thick the circles in the diagram are drawn. We can also control the colors of each color. Here is an example worksheet.
> restart:
> with(Statistics):
> upper_limit := 1000:
> multiples_3 := {seq(3..upper_limit, 3)}
> multiples_7 := {seq(7..upper_limit, 7)}
> numbers := {seq(1 .. upper_limit)}:
> circle_colors := [“Blue”, “Orange”]:
> legends := [“Multiples of 3”, “Multiples of 7”]:
> diagram_font := [“Courier”, “Bold”, 20]:
> VennDiagram(
multiples_3, multiples_7,
universe = numbers,
legend = legends,
colors = circle_colors,
font = diagram_font,
thickness = 5)

This diagram is much easier to read than the previous diagram. Notice that in this worksheet, we separated some arguments to the VennDiagram command on separate lines using “Shift + Enter.”
Maple’s Venn Diagram capabilities are somewhat limited because in some problems, we only have partial information. Sometimes, we may know some information about the intersections of some events, but not others.
Here is an example involving three events.
Suppose the judges at a kangaroo show have given out a collection of red, green and blue ribbons.
There were 70 ribbons of each color given out, and only 10 kangaroos did not receive ribbons.
We know that 35 kangaroos received a red and green ribbon, 27 kangaroos received a red and blue ribbon, and 32 kangaroos received a green and blue ribbon.
Only 3 kangaroos received all three ribbons.
We summarize everything we know:
| ✦: 70 | ✦ ✦: 35 | ✦ ✦ ✦: 3 | ||
| ✦: 70 | ✦ ✦: 27 | -: 10 | ||
| ✦: 70 | ✦ ✦: 32 |
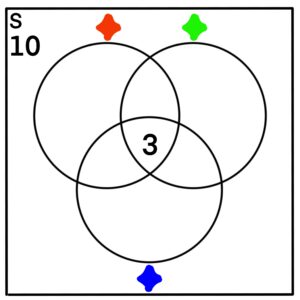
We want to know how many kangaroos were at the show. We start by filling in the information into a Venn Diagram. Note that while ✦ was given out to 70 kangaroos, there is overlap with kangaroos who won ✦ and ✦, so we can’t fill in any section within the ✦ circle with 70, as that would be incorrect. The 70 value represents the entirety of ✦. The same goes for ✦ and ✦.
Furthermore, the event ✦ ✦ has overlap with ✦, so we can’t label any section of the ✦ ✦ part with 35. The same goes for event ✦ ✦ and ✦ ✦.
The only sections we can fill in initially are those sections associated with events
✦ ✦ ✦, and -.
As such, we fill those sections in.

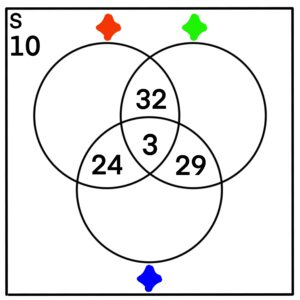
Since we know ✦ ✦ = 35 and that ✦ ✦ ✦ = 3, we can figure out the parts of the Venn Diagram that are in ✦ ✦ ✦C, ✦ ✦C ✦, and ✦C ✦ ✦.
| ✦ ✦ ✦C | = | ✦ ✦ – ✦ ✦ ✦ |
| = | 35 – 3 | |
| = | 32 |
| ✦ ✦C ✦ | = | ✦ ✦ – ✦ ✦ ✦ |
| = | 27 – 3 | |
| = | 24 |
| ✦C ✦ ✦ | = | ✦ ✦ – ✦ ✦ ✦ |
| = | 32 – 3 | |
| = | 29 |

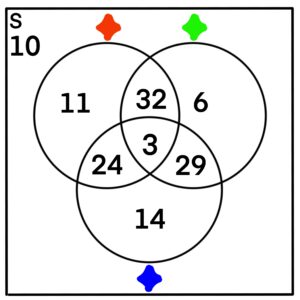
Using a similar procedure, we can figure out the numbers for the remaining parts of the Venn Diagram:
| ✦ ✦C ✦C | = | 70 – 32 – 24 – 3 |
| = | 11 |
| ✦C ✦ ✦C | = | 70 – 32 – 29 – 3 |
| = | 6 |
| ✦C ✦C ✦ | = | 70 – 29 – 24 – 3 |
| = | 14 |

Now that we know all sections of the Venn Diagram, we can simply add up all the numbers to get the number of kangaroos who participated in the show:
| 010 | |
| + | 011 |
| + | 014 |
| + | 006 |
| + | 024 |
| + | 032 |
| + | 029 |
| + | 003 |
| = | 129 |
So 129 kangaroos participated in the show.